Interface Overview
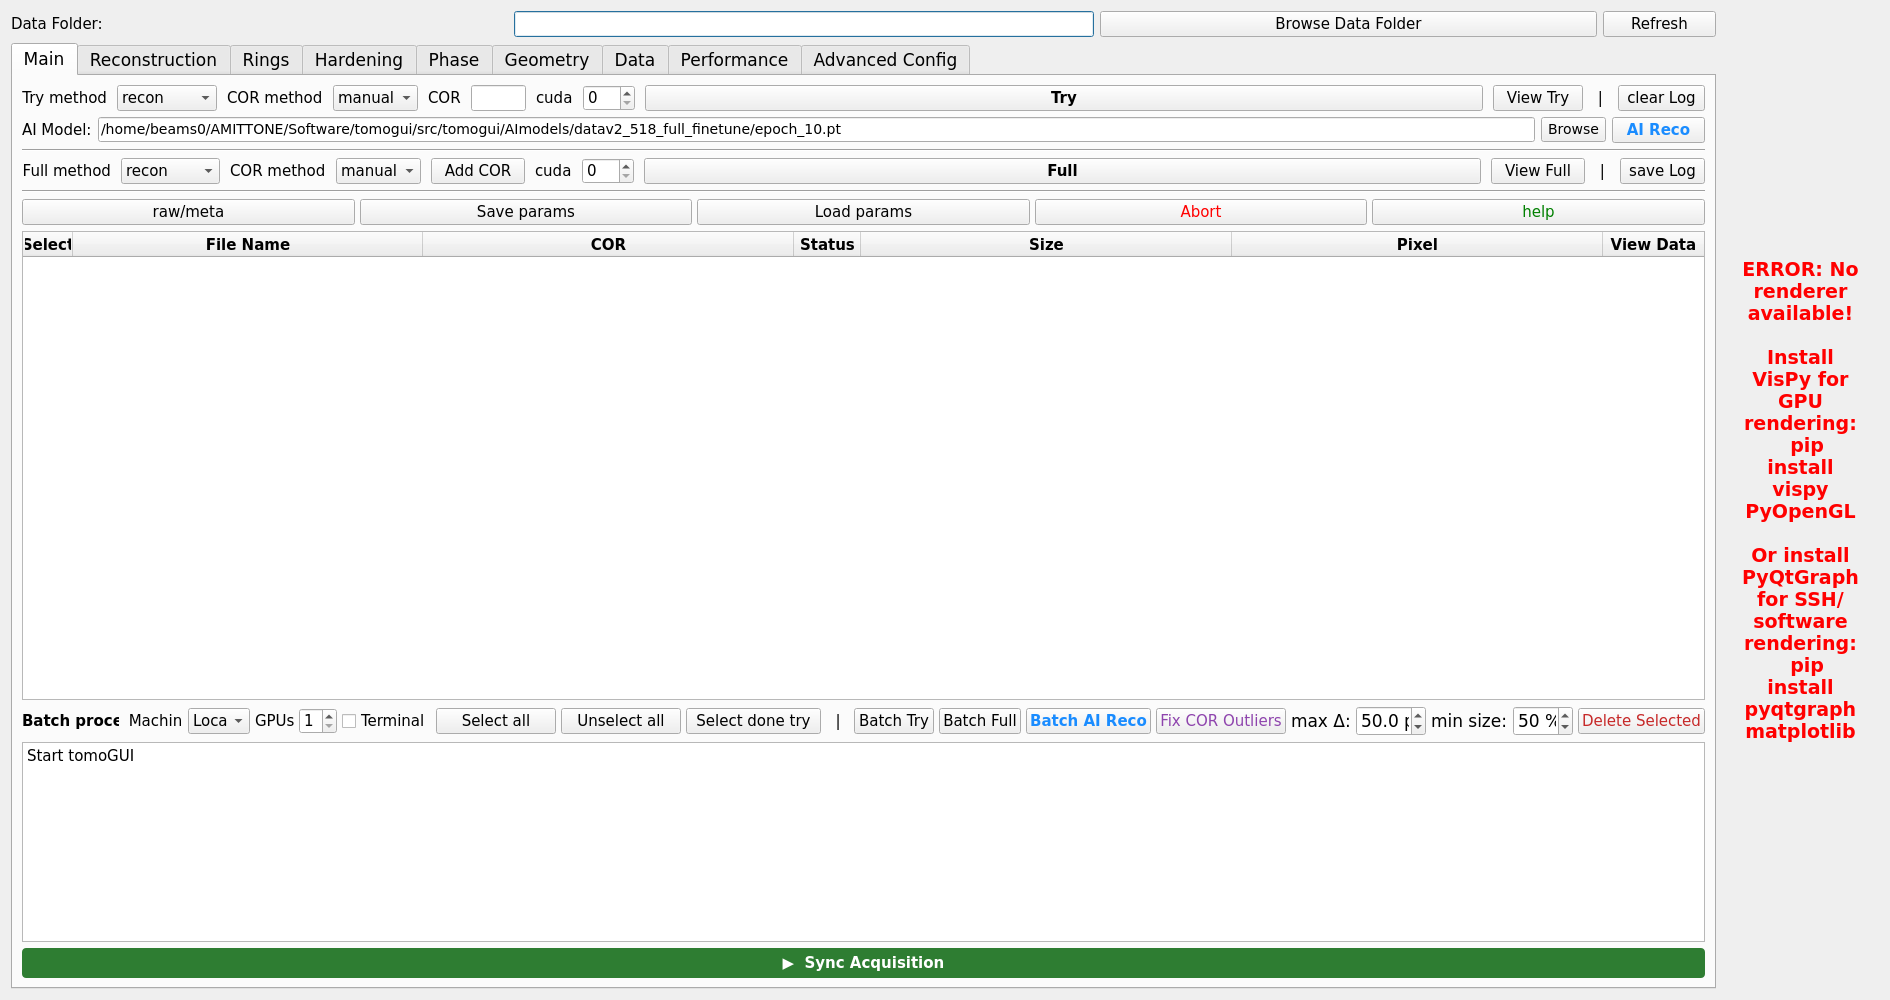
TomoGUI is split into a left-hand control panel (parameters, tabs, log) and a right-hand visualisation area (image, contrast, slice controls).

TomoGUI main window.
Main Window Layout
┌─────────────────────────────────────────────────────────┐
│ TomoGUI                                         🌙 / ☀   │
├──────────────────┬──────────────────────────────────────┤
│                  │                                      │
│  Control Panel   │     Visualisation Area              │
│  (Left)          │     (Right)                         │
│                  │                                      │
│  Data Folder     │  Matplotlib canvas                  │
│  Projection File │  Navigation toolbar                 │
│                  │  Colormap, Contrast, Auto-5/95 %    │
│  Tabs            │  Slice / COR slider                 │
│   • Main         │  TomoLog panel                      │
│   • Recon        │                                      │
│   • Hardening    │                                      │
│   • Phase        │                                      │
│   • Rings        │                                      │
│   • Geometry     │                                      │
│   • Data         │                                      │
│   • Performance  │                                      │
│   • Advanced Cfg │                                      │
│   • Batch        │                                      │
│   • HDF5 Viewer  │                                      │
│                  │                                      │
│  Log Output      │                                      │
│                  │                                      │
└──────────────────┴──────────────────────────────────────┘
Top tab bar

The tab bar switches between:
Main — single-file and batch workflow in one view (Try, Full, AI Reco, TomoLog controls plus the file/batch table with Fix COR Outliers and Delete Selected)
Reconstruction / Hardening / Phase / Rings / Geometry / Data / Performance — per-category TomoCuPy parameter tabs
Advanced Config — remote host, GPU count, AI model path, extra flags
Left Panel
Data Selection
At the top of the left panel:
- Data Folder
Current data directory
Browse Data Folder button
Path is persisted between sessions
- Projection File
Dropdown of
.h5files in the folder, newest firstRefresh button reloads the list
- Sync Acquisition
Automatically refreshes the dropdown as new files appear in the acquisition folder (useful during a live scan)

Tab System
Main Tab
Single-file workflow:
Try / Full — reconstruction controls (see Reconstruction Workflow)
AI Reco — DINOv2 automatic COR (see AI Reconstruction)
TomoLog — PDF report generator with per-file auto-contrast
View Try / View Full — quick access to the reconstructed output
Reconstruction Parameters Tabs
Per-category tabs below the Main tab expose every TomoCuPy flag:
Recon — algorithm (
FBP,gridrec,LPREC), binning, nsino-per-chunk, start / end slice, etc.Hardening — beam hardening correction
Phase — phase retrieval (alpha, energy, distance, …)
Rings — ring removal (sigma, level, algorithm)
Geometry — rotation axis geometry
Data — projection range, flat/dark correction
Performance — nthreads, blocked_views, etc.
Settings are stored per dataset in a JSON sidecar so reloading a file restores its last-used parameters.
Advanced Config Tab
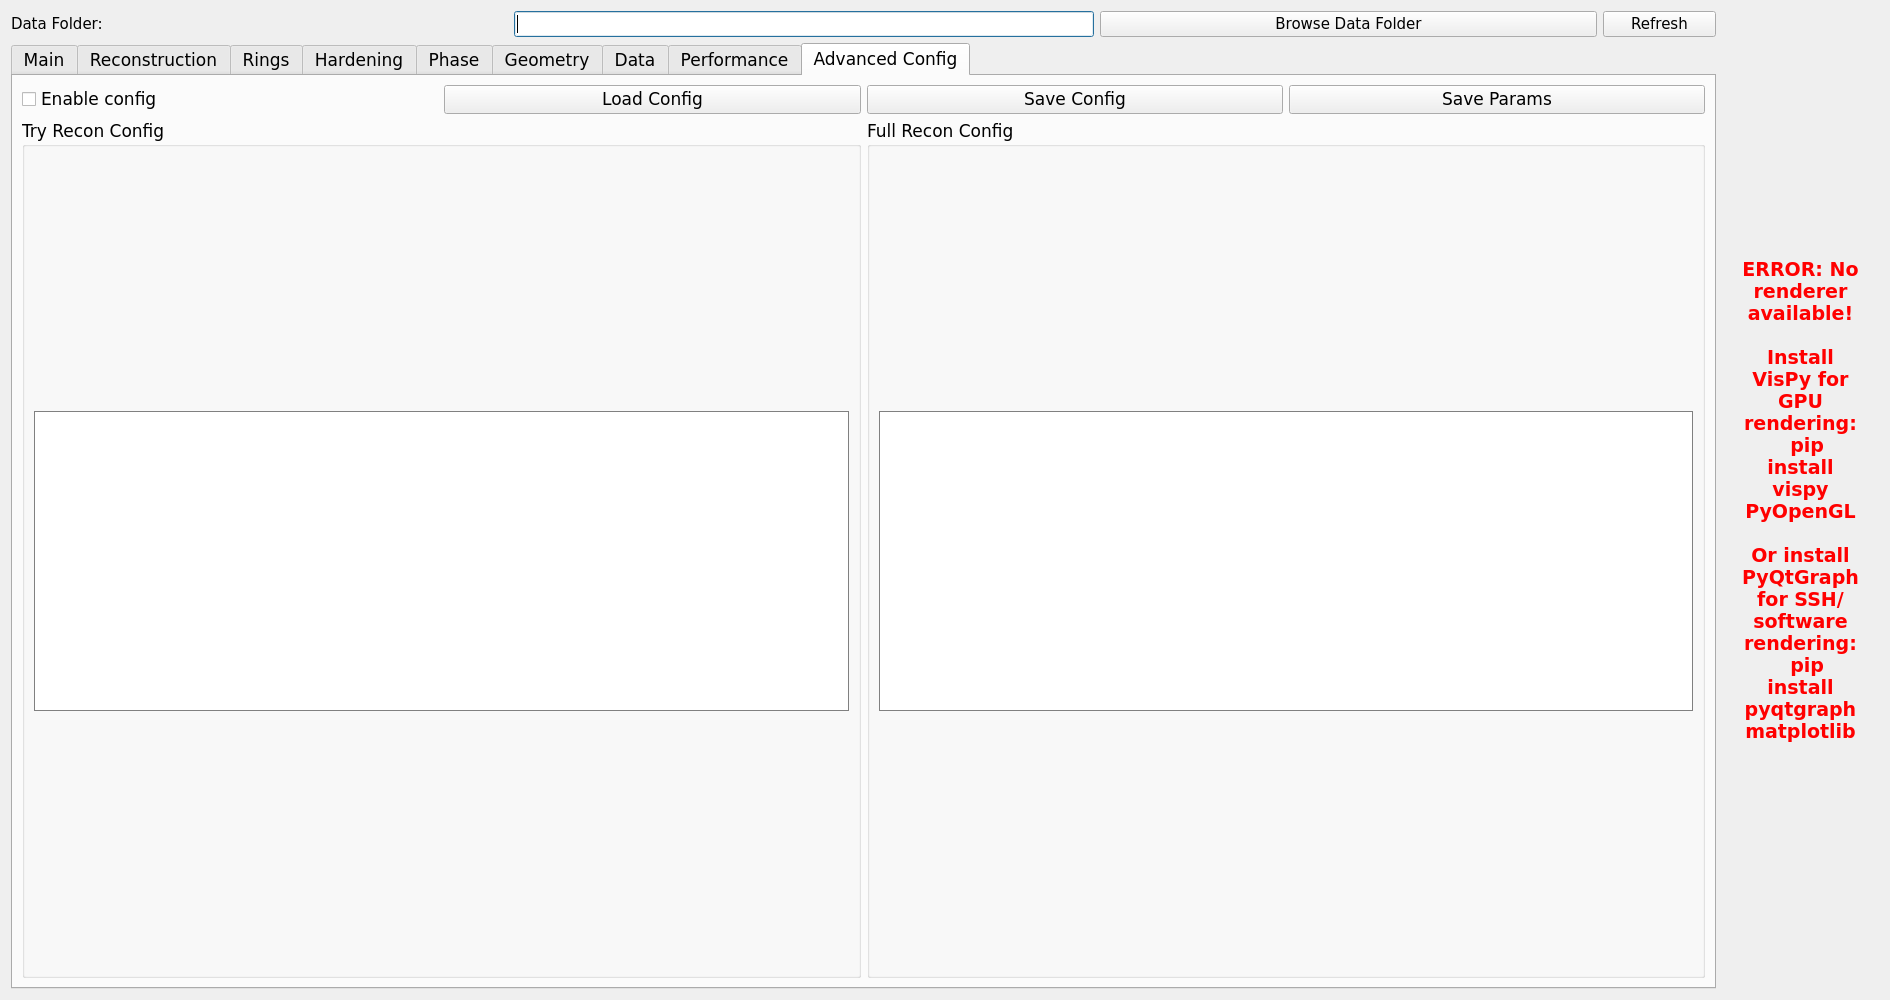
Cross-cutting configuration:
Remote host — SSH user@host for running reconstruction on a remote GPU node
Number of GPUs — parallelism for every batch phase (one file per GPU slot, next dispatched on slot free)
AI model path — absolute path to the
.pthcheckpointExtra flags — free-form extra command-line flags appended to
tomocupyinvocations
Batch table (on the Main tab)
See Batch Processing Guide for the full batch workflow. Key controls:
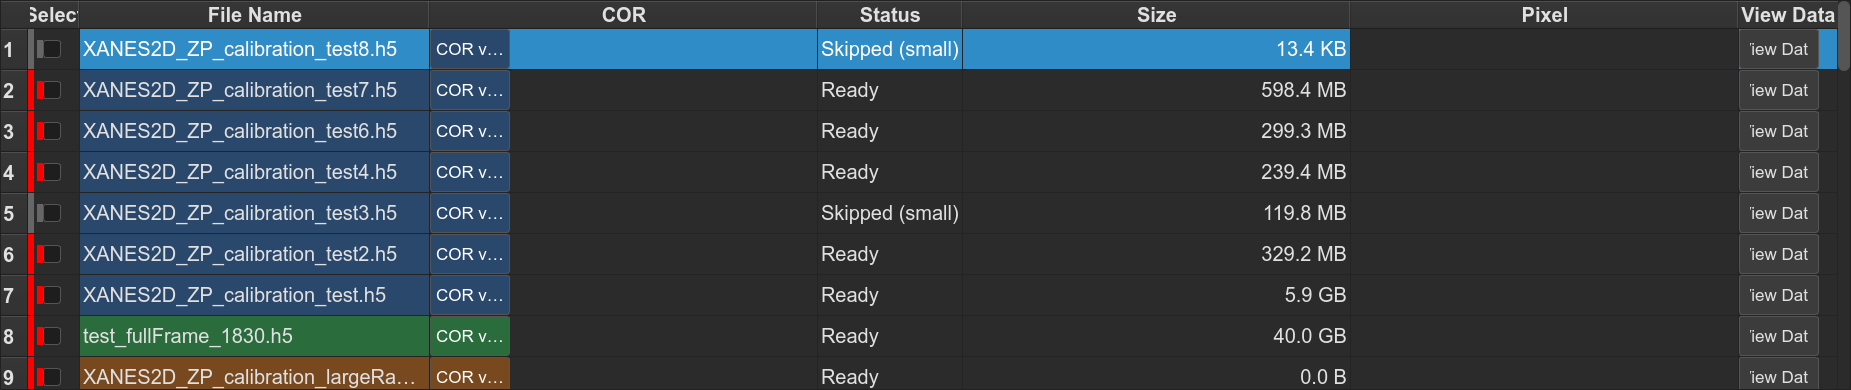
file table with per-row checkbox, COR, status, and series tint
Batch Try, Batch Full, Batch AI Reco, → TomoLog (optional Phase D upload)
Fix COR Outliers (also fills missing CORs from series mean), with Max COR delta (default 50 px)
Delete Selected (with confirmation)
Shift-click range selection
HDF5 Viewer
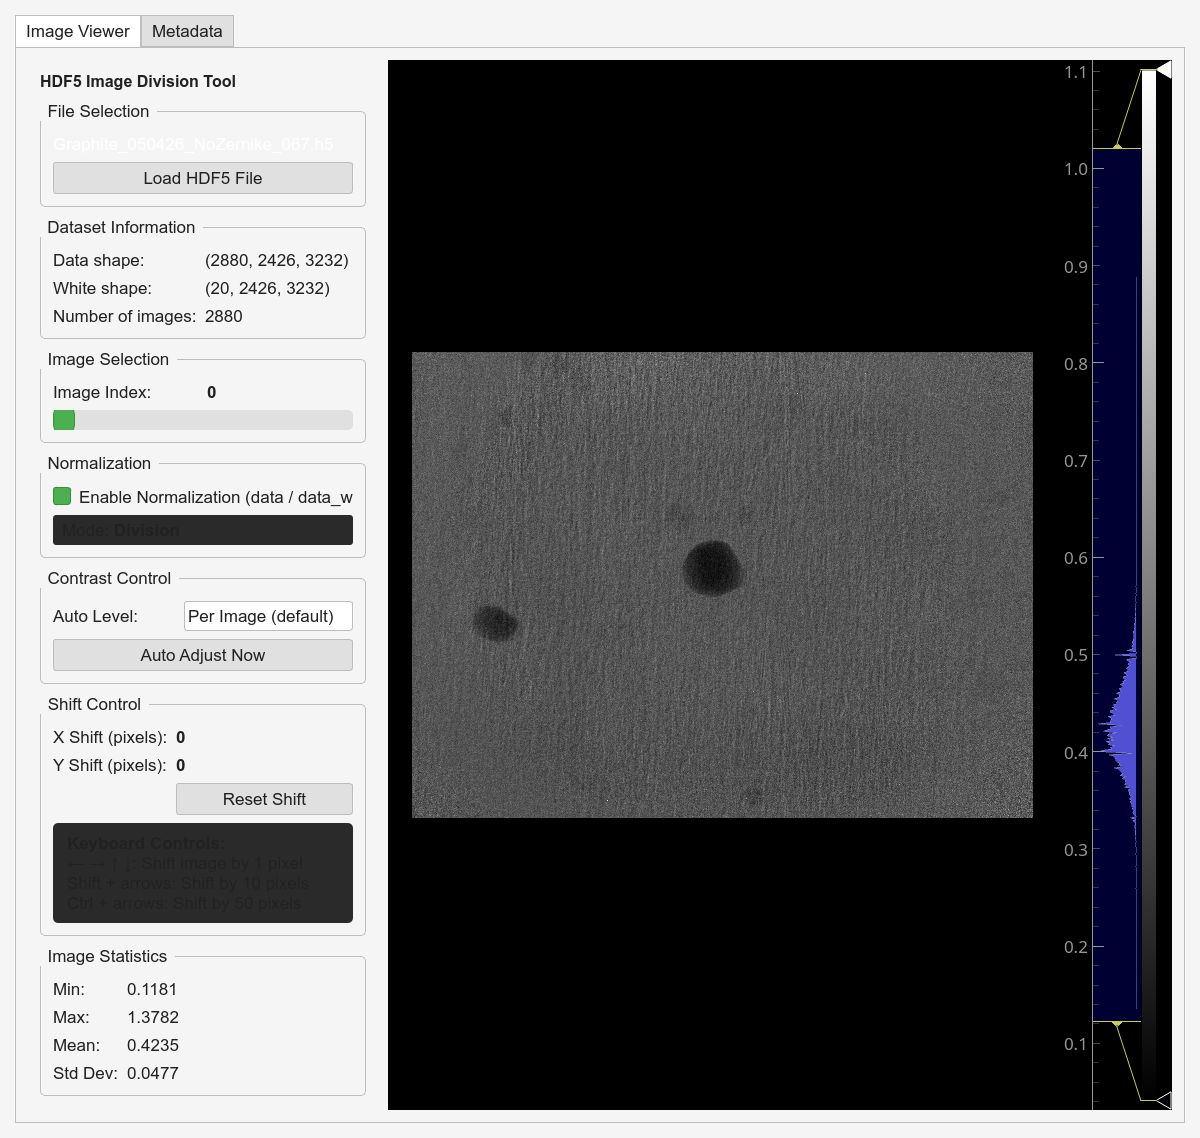
Right-click a row → View Data to open the HDF5 viewer on that file — browse the group tree, scrub through projections, check metadata.
Right Panel
Image display
matplotlib canvas with navigation toolbar (pan, zoom, save)
colormap selector (gray, viridis, magma, …)
Contrast — Min / Max inputs, Auto (5 – 95 % percentile), Reset
Slice / COR slider — when viewing a try-center grid, the slider scrubs through candidate CORs; when viewing a Full reconstruction, the slider scrubs through slices.
The auto-contrast behaviour also applies to TomoLog when Min/Max are blank.
Log Output
Structured log with colour-coded statuses:
✓ success (green)
✗ failure (red)
⚠ warning (amber)
🚀 job start
During Batch AI Phase B, per-file lines like
[infer-worker] OK /data/.../sample_007.h5 => 1024.3 stream live and
the corresponding COR cell updates in real time.