Getting Started
Launching TomoGUI
Start TomoGUI from the command line:
tomogui
The main window opens ready to load a dataset.

TomoGUI main window with a dataset loaded. Left: controls and the parameter tabs. Right: reconstructed image with contrast and slice controls.
Basic Workflow
Select Data Folder — click Browse Data Folder and navigate to your tomography data directory. HDF5 projection files in the folder appear in the Projection File dropdown (and in the Batch tab).
Select Projection File — pick the
.h5file to reconstruct.Configure Reconstruction — reconstruction method, COR method, algorithm, binning, nsino-per-chunk, ring-removal, phase retrieval, etc.
Try — click Try to run a quick multi-COR try reconstruction. The result appears under
<folder>_rec/try_center/<dataset>/.View Try — switch to the try-center slice viewer and pick the best COR, or let AI Reco choose one automatically (see AI Reconstruction).
Full — click Full to run the full reconstruction with the chosen COR.
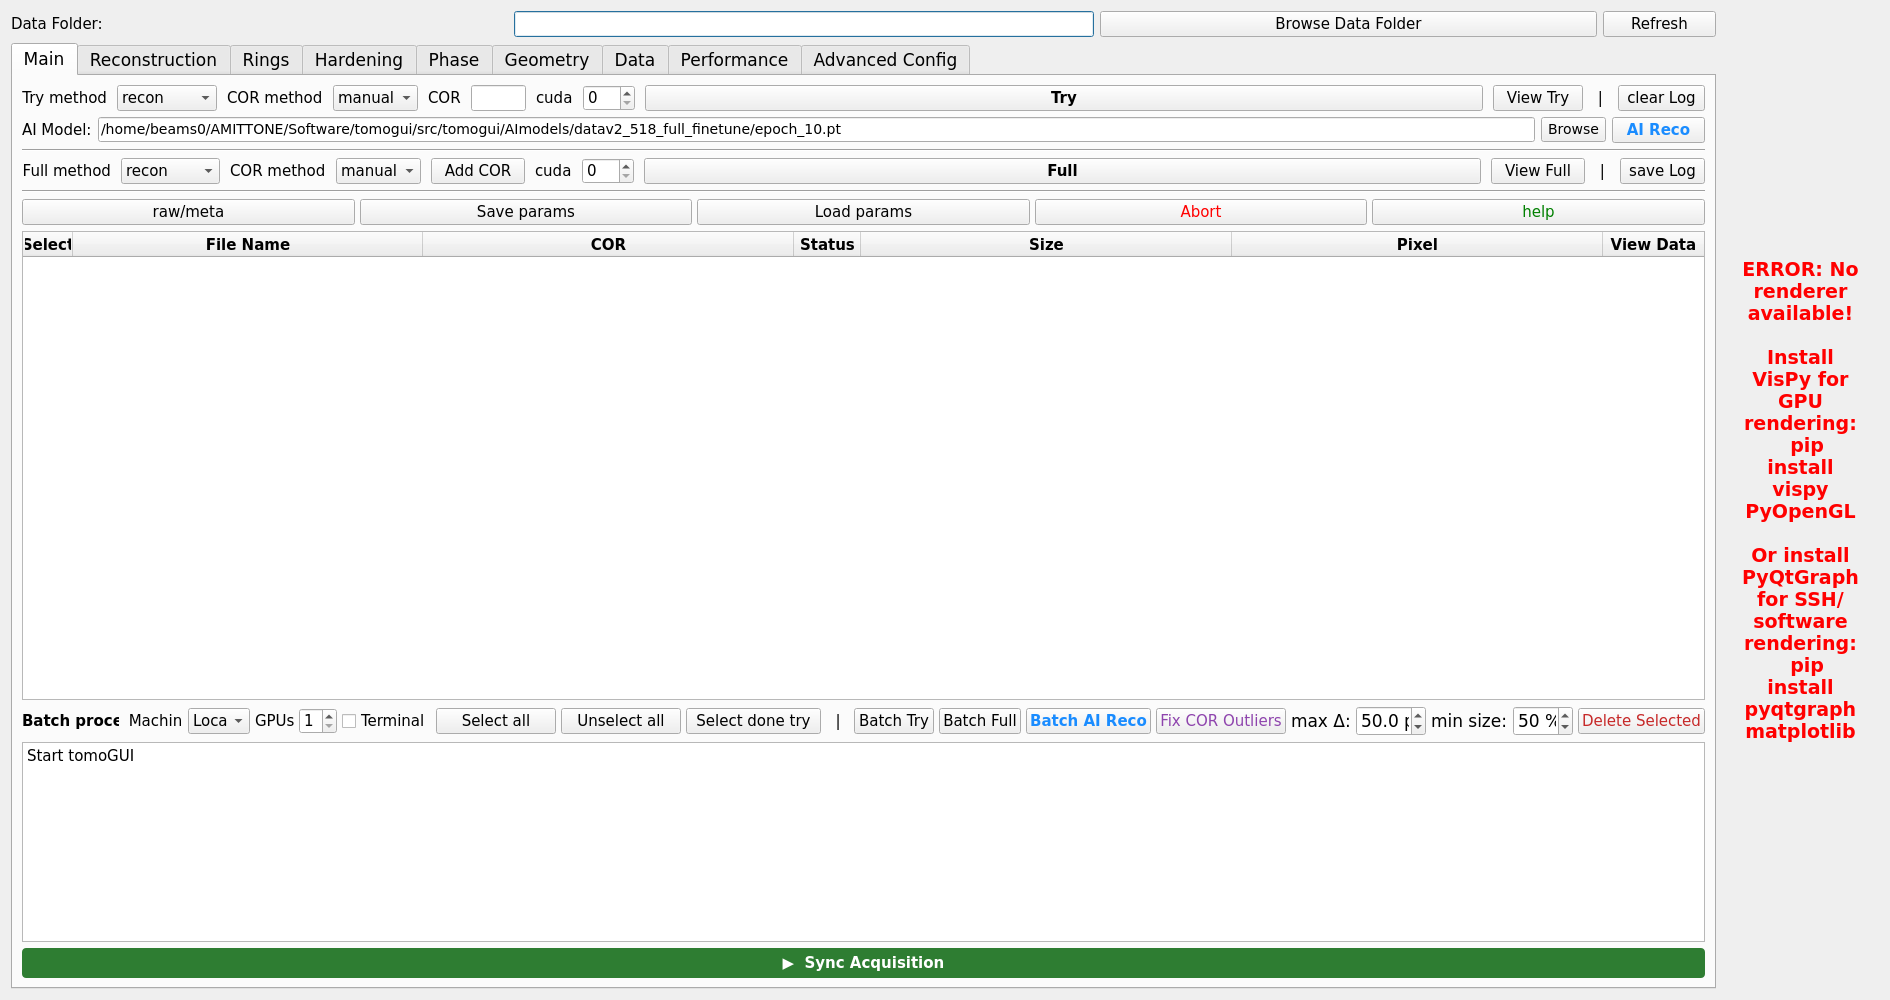
Main tab with dataset selected and reconstruction parameters filled in.
Your First Reconstruction
1. Browse Data Folder      → /data2/32ID/2026-04-Allen-0/
2. Projection File         → sample_0001.h5
3. Reconstruction method   → recon
4. COR method              → manual
5. COR value               → 1024.5
6. GPU                     → 0
7. Click Try
8. Click View Try, pick the best slice
9. Click Full
After Try, the try-center grid can be previewed directly in the image panel and the COR slider on the right lets you scrub through candidate centers.
Understanding the Interface
Main Layout
The window is divided into two main panels:
- Left Panel — controls and parameter tabs:
Main — Try / Full / AI Reco / TomoLog buttons and common parameters
Reconstruction — algorithm, nsino-per-chunk, binning, etc.
Hardening — beam hardening correction
Phase — phase retrieval parameters
Rings — ring artifact removal
Geometry — geometric corrections
Data — data preprocessing
Performance — performance tuning
Advanced Config — full configuration file editing
Batch — multi-file batch processing (see Batch Processing Guide)
HDF5 Viewer — inspect projections and metadata
- Right Panel — visualisation:
matplotlib image display with toolbar
colormap controls
contrast (Auto 5–95 % / Reset / Min / Max)
slice / COR slider
TomoLog integration panel
Log Output
- The log area shows:
command execution status
success / failure messages
processing progress
error information
per-file streaming during Batch AI Phase B
Status indicators use coloured text: green ✓ for success, red ✗ for failure, amber for warnings.
Next Steps
Interface Overview — tour of the full UI
Reconstruction Workflow — reconstruction parameters in depth
AI Reconstruction — automatic COR discovery with DINOv2
Batch Processing Guide — hundreds of datasets with multi-GPU execution
Themes — Light / Dark themes